The Big Bear housing market is constantly evolving, shaped by seasonal trends, buyer demand, and the unique appeal of mountain living. Whether you’re looking for a vacation getaway, an

Dated: September 24 2026
Views: 0
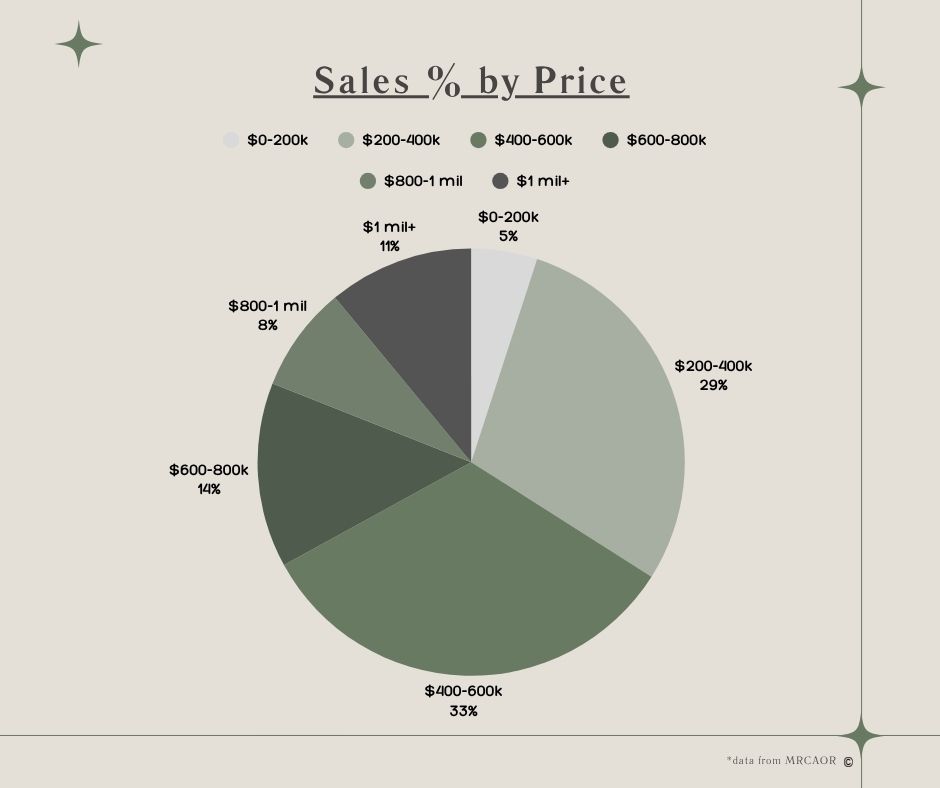
The Big Bear housing market is constantly evolving, shaped by seasonal trends, buyer demand, and the unique appeal of mountain living. Whether you’re looking for a vacation getaway, an investment property, or a permanent home; understanding the current market conditions is key to making informed decisions. From inventory levels to average home prices and days on market, staying up to date on Big Bear’s real estate trends can give buyers and sellers a competitive edge in this dynamic mountain community. Heading into summer we are seeing changes in home sales price, how long it takes a home to sell, and available listings. Read below for more details...
Close to list price ratio: 97.3%
Last Month: 98.3%
Last Year: 97.1%
This provides insight into how closely homes are selling to their listing price. This metric reflects both market competitiveness and buyer demand; ratios near or above 100% often indicate a strong seller’s market, while lower percentages may suggests room for buyers to negotiate. This information helps buyers make competitive offers and helps sellers price their homes strategically based on real market behavior.
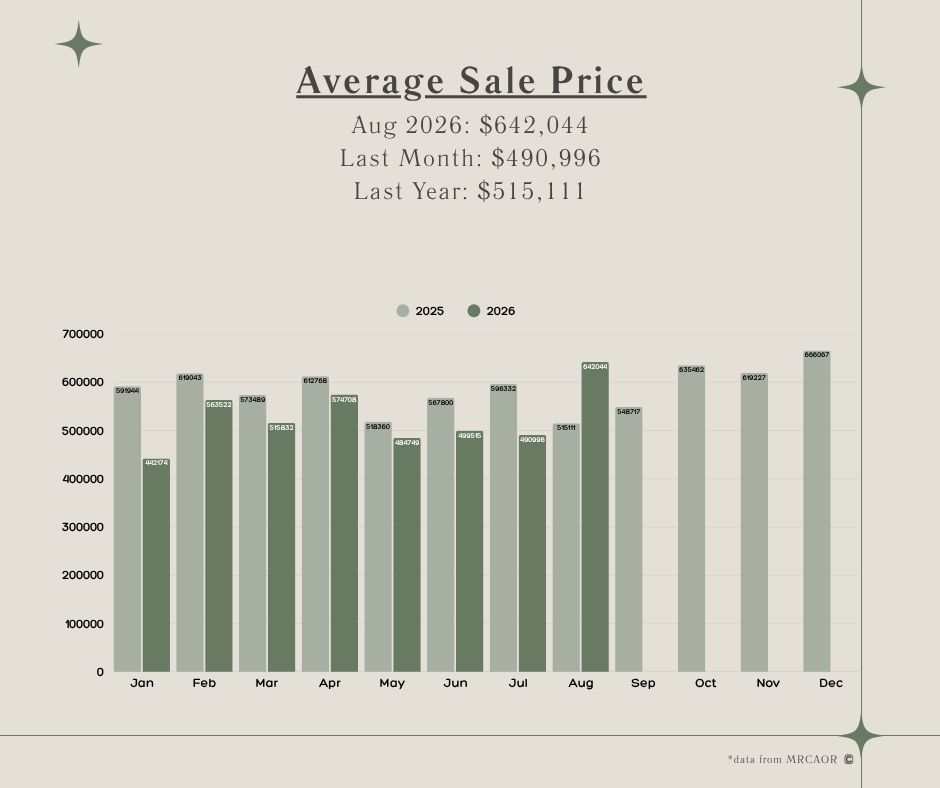
Average Sale Price: $642,044
Last Month: $490,996
Last Year: $515,111
This data helps buyers determine what they can expect to pay for a home and ensures they’re making a competitive and informed offer. For sellers, it provides a realistic benchmark for pricing their home effectively.
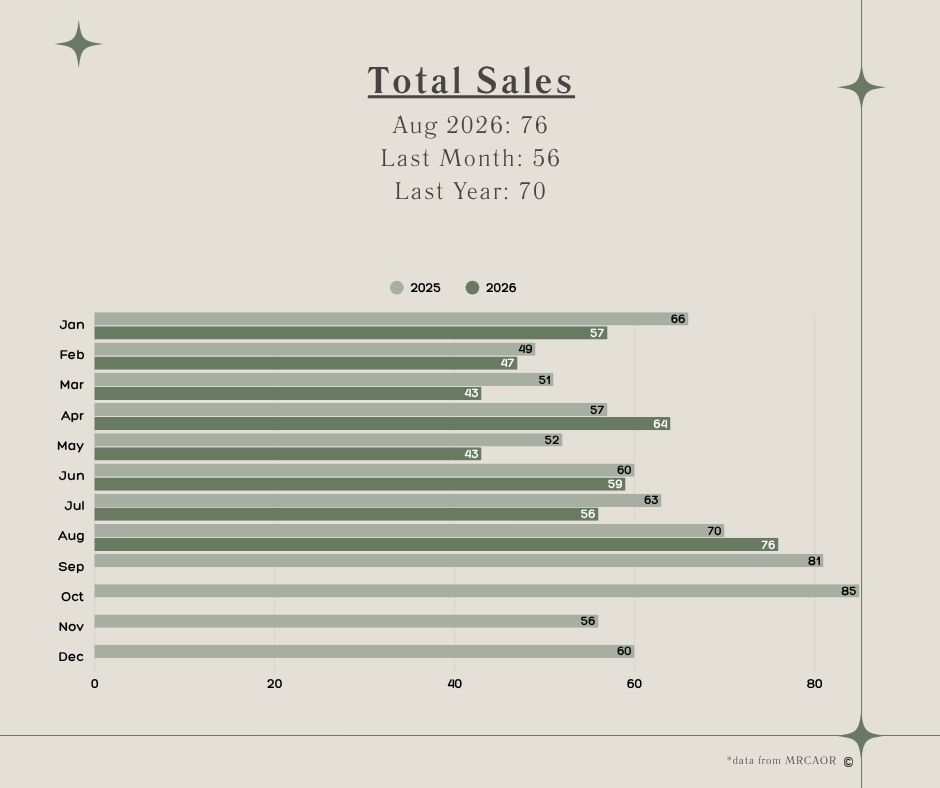
Total number of sales: 76
Last Month: 56
Last Year: 70
By tracking monthly and yearly sales trends this visual helps reveal shifts in demand and the overall market momentum. A high number of sales typically indicates a strong, active market, while fewer sales may suggest a slowdown or shift in buyer behavior. It’s a valuable tool for understanding how active the market has been and what that might mean for buyers and sellers moving forward.
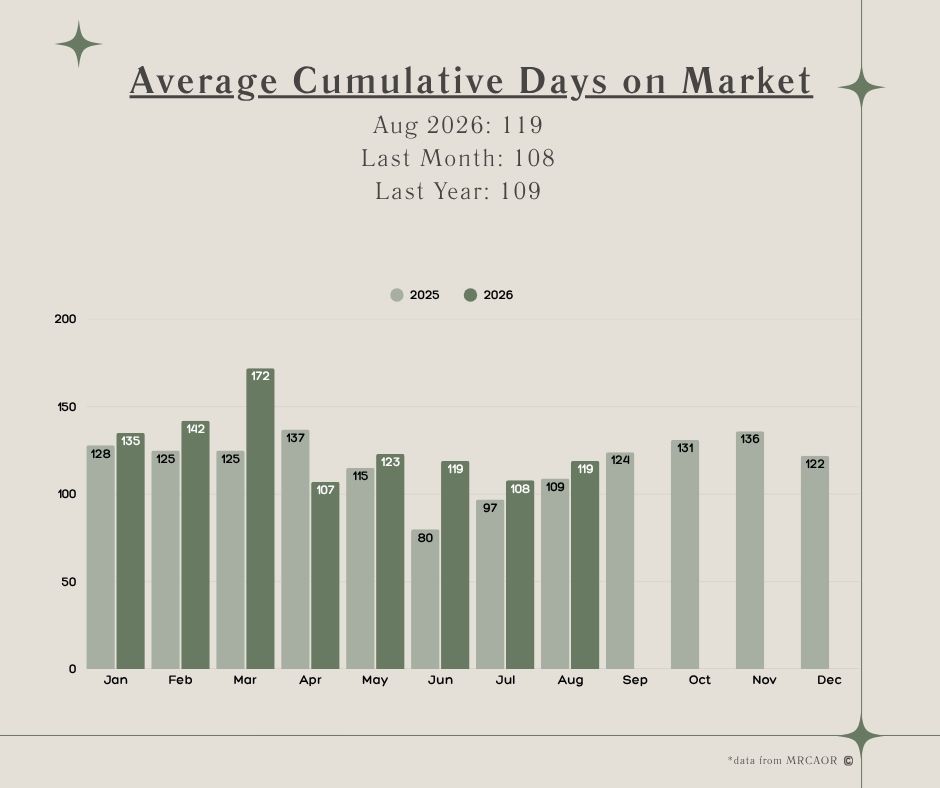
Average cumulative days on market: 119
Last Month: 108
Last Year: 109
This gives insight into how quickly properties are selling over time. If homes are selling quickly, it may indicate a competitive market where buyers need to act fast. On the other hand, if listings are sitting longer, it could signal more negotiating power for buyers or potential issues with pricing or demand. Understanding this trend can help buyers and sellers set realistic expectations and make more informed decisions.
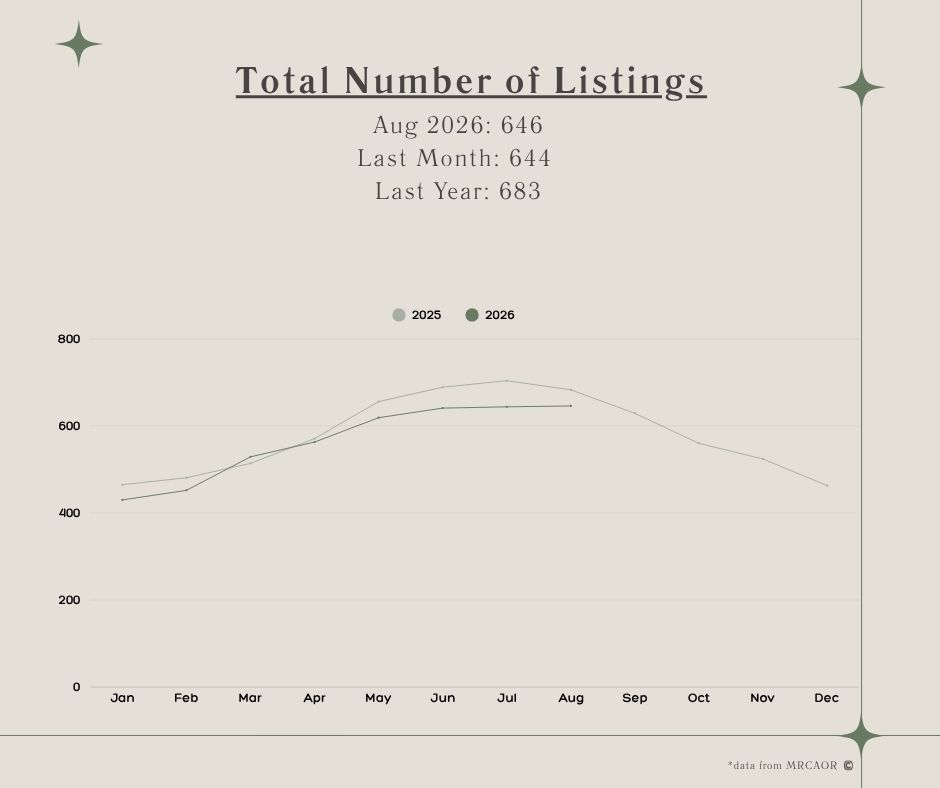
Total Active listings: 646
Last Month: 644
Last Year: 683
Tracking this trend helps reveal whether inventory is tightening or expanding, which can impact pricing, competition, and buyer or seller leverage. A high number of active listings may indicate a buyer’s market, where there’s more choice and potential for negotiation. Fewer listings can signal a seller’s market, where demand outpaces supply and homes may sell quickly. It’s a useful indicator for understanding current market conditions and planning your next move accordingly.
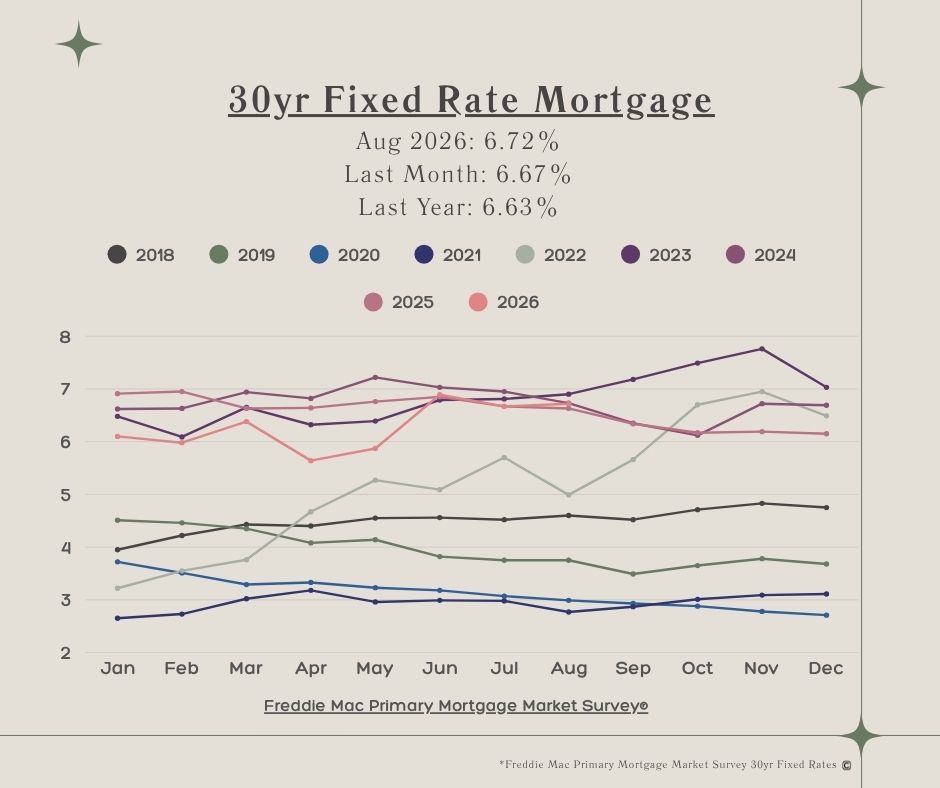
Intrest rates: 6.72%
Last Month: 6.67%
Last Year: 6.63%
This shows the historical trend of 30-year fixed mortgage rates. Rates have held steady since October 2022; with small shifts quickly coming back in line around 6.5%. By seeing how rates have changed over time you can gauge whether current rates are favorable and allows you to make more informed decisions about when to buy or refinance. Understanding these shifts provides valuable context for anyone planning to buy, sell, or refinance a home.
Many factors influence the mortgage rate; inflation, government policy, securities market, economic growth, employment rate, global events, geopolitical events, and housing market demands. With so many forces at play, there’s often a delay or trickle-down effect. As the broader economy adjusts to the Fed’s new benchmark rate mortgage rates will soon follow.
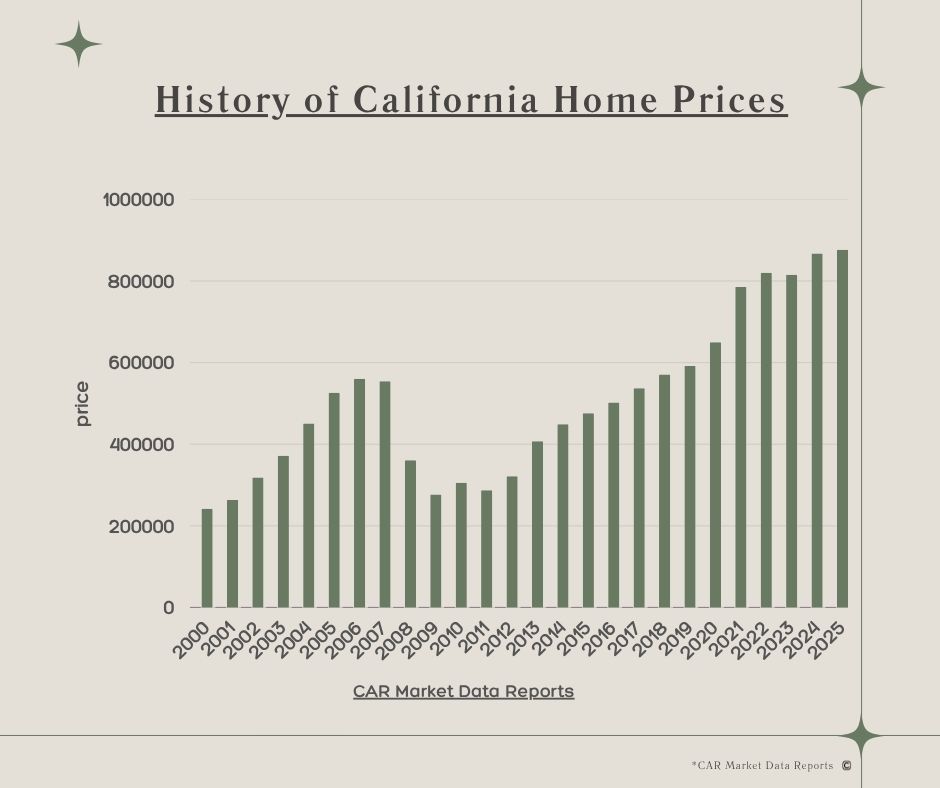
2025 CA median home price: $867,429
The graph below illustrates the historical trend of home prices in California since 2000. Showing year-by-year changes, this graph offers a clear visual representation of how the market has evolved; highlighting steady growth in real estate value. With the exception of 2008 real estate crash (which created many changes in mortgage qualifications and lending laws) real estate values steadily increase. Think of paying your mortgage each month as a deposit into a savings account building equity year over. This historical perspective can highlight patterns allowing for more informed decisions about when to buy, sell, or invest. It also provides context for evaluating current home prices relative to past market conditions. This data helps buyers, sellers, and investors better understand long-term patterns and make more informed real estate decisions.
Whether you’re considering buying a cozy cabin retreat or selling your mountain property, staying informed about local trends is essential. As the market evolves with the seasons, having a trusted real estate professional by your side can help you make confident, well-timed moves in Big Bear’s ever-changing market. If you have more questions or would like to set up a home-buying road map give me a call!

As a local realtor in Big Bear Lake and the surrounding mountain area I will help you navigate the unique experience of living on the mountain. Big Bear is unlike any other town in Southern California....
The Big Bear housing market is constantly evolving, shaped by seasonal trends, buyer demand, and the unique appeal of mountain living. Whether you’re looking for a vacation getaway, an
If you’re financially ready to buy a home but hesitating because of current interest rates, here’s why waiting might be the most expensive decision you could make…“I’m
 All information deemed reliable but not guaranteed and should be independently verified. All properties are subject to prior sale, change or withdrawal. Neither listing broker(s) nor Tyler Wood Group shall be responsible for any typographical errors, misinformation, misprints and shall be held totally harmless.
Property locations as displayed on any map are best approximations only and exact locations should be independently verified.
Lifestyle, neighborhood, and school data ("Supplemental
Data") is provided by the operator of this website as a convenience to users. This Supplemental Data is not provided or reviewed by Big Bear Association of Realtors. The operator of this website updates the Supplemental Data from time to time, but it does not represent, warrant or otherwise promise that the Supplemental Data is current, free from defects, or error-free. All Supplemental Data is provided AS IS with all faults. Users are encouraged to consult their own data sources to confirm the accuracy of all Supplemental Data before using the Supplemental Data as a basis for any decision.
Show More...
All information deemed reliable but not guaranteed and should be independently verified. All properties are subject to prior sale, change or withdrawal. Neither listing broker(s) nor Tyler Wood Group shall be responsible for any typographical errors, misinformation, misprints and shall be held totally harmless.
Property locations as displayed on any map are best approximations only and exact locations should be independently verified.
Lifestyle, neighborhood, and school data ("Supplemental
Data") is provided by the operator of this website as a convenience to users. This Supplemental Data is not provided or reviewed by Big Bear Association of Realtors. The operator of this website updates the Supplemental Data from time to time, but it does not represent, warrant or otherwise promise that the Supplemental Data is current, free from defects, or error-free. All Supplemental Data is provided AS IS with all faults. Users are encouraged to consult their own data sources to confirm the accuracy of all Supplemental Data before using the Supplemental Data as a basis for any decision.
Show More...
